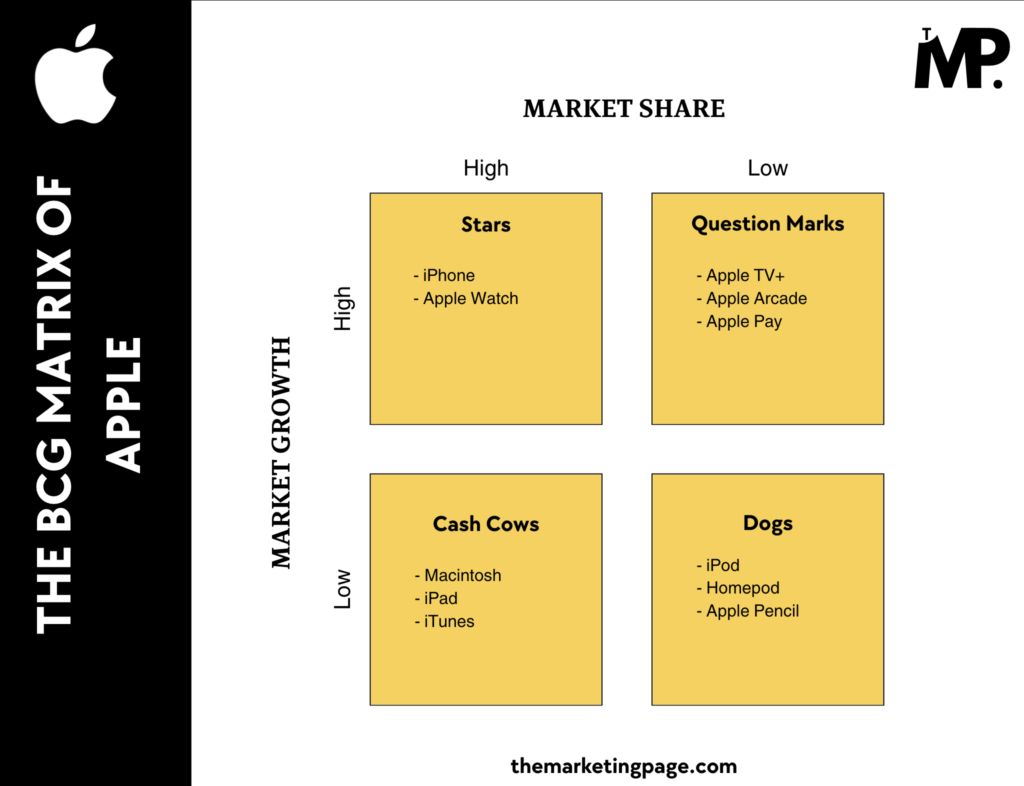
The BCG Matrix is a crucial tool for analyzing Apple’s diverse product portfolio.
When we take a closer look at Apple’s product portfolio through the BCG Matrix, we can categorize its products into four groups:
- Stars
- Cash Cows
- Question Marks
- Dogs
The BCG Matrix helps us understand how Apple’s different products are performing by looking at their market growth and share, highlighting which products are leaders and where improvements are needed.
Overview of Apple
Apple Inc. is one of the world’s most valuable technology companies, known for its innovative products and strong brand loyalty.
Founded in 1976, Apple has grown into a global leader in consumer electronics, software, and services. Its product lineup includes the iPhone, Mac computers, iPad, Apple Watch, and accessories like AirPods, as well as a range of digital services such as iCloud, Apple Music, and Apple TV+.
With Tim Cook as CEO, Apple continues to drive innovation while maintaining a strong focus on sustainability and user privacy. In 2023, Apple generated $383 billion in revenue with a net income of $96 billion, solidifying its position as a dominant player in the tech industry.
Now, let’s explore how Apple’s diverse product range fits into the BCG Matrix to assess their market positions and growth potential.
BCG Matrix Analysis of Apple
The BCG Matrix provides a clear snapshot of Apple’s product portfolio which helps in identifying which products are driving growth, generating cash, or facing challenges in the market.
Here’s how Apple’s major products fit into the BCG Matrix in 2024:


1. Stars (High Market Share, High Market Growth)
Key Products: iPhone and Apple Watch
The iPhone remains Apple’s flagship product. It is dominating the smartphone market with strong demand and frequent innovations, like the iPhone 15. The iPhone line continues to enjoy high market growth and a dominant market share with its consistent updates and a loyal customer base.
Source: iPhone 15 is the World’s Best-selling Smartphone in Q3 2024
The Apple Watch, especially the Apple Watch Ultra, leads the wearable tech category. The high growth of Apple Watch is due to increasing health and fitness tracking features. As the dominant player in the wearables market, it belongs in the Star quadrant.
Apple topped market share up to 21% followed by Fire-bolt, Samsung, Huaweii, and other models.
2. Cash Cows (High Market Share, Low Market Growth)
Key Products: Mac, iPad, and iTunes
The Mac lineup, including the MacBook Pro and iMac, holds a solid position in the computer market. While growth in the PC market is relatively low, Apple’s premium positioning and loyal customer base allow it to generate significant profits with a steady market share.
In Q4 of Apple’s 2024 fiscal year, Mac computers brought in $7.7 billion in revenue, slightly up from $7.6 billion in the same quarter last year.
Although the tablet market has matured, the iPad remains the leader in this category. The iPad Pro and iPad Air bring consistent revenue due to their dominance in different sectors (despite limited growth in the overall tablet market).
Apple holds market share of 31.7% in 2024 making it a cash cow.
While music downloads are declining due to streaming, iTunes still generates stable revenue from established customers.
3. Question Marks (Low Market Share, High Market Growth)
Key Products: Apple TV+, Apple Arcade, and Apple Pay
Apple’s streaming service is still in its growth phase but lags behind competitors like Netflix (22%) and Disney+ (11%) in market share. Despite high potential in the rapidly growing streaming industry, Apple TV+ (9%) faces tough competition, making it a Question Mark.
Gaming services are a high-growth sector, but Apple Arcade has not achieved widespread adoption compared to competitors. Its relatively low market share in a booming industry positions it as a Question Mark.
Apple Pay holds a 14.21% market share in the digital payments space which Question Mark. While it shows significant growth potential as digital payment solutions gain traction, it faces fierce competition from established players like PayPal (47.74%) and Stripe (8%), which limits its current market share
4. Dogs (Low Market Share, Low Market Growth)
Key Products: iPod, HomePod, and Apple Pencil
While technically still part of Apple’s product lineup, the iPod has become largely irrelevant in today’s market due to the rise of smartphones and streaming services. It has very low market share and no significant growth potential, making it a Dog.
Apple’s smart speaker, the HomePod, competes with Amazon’s Echo and Google Home, but has struggled to gain significant market share as it has only 6% market share. Even out of 40% apple users, 19% of them own Google smart speaker. With slow growth in this sector and stiff competition, HomePod falls into the Dog category. (Source: Why Apple’s smart home speaker dreams are still falling short)
While useful for certain applications, Apple Pencil has limited adoption outside the creative community, and the growth potential is low compared to other stylus options in the market.
Apple should evaluate their viability and consider integrating them with more successful products.
Concluding the Analysis
In this comprehensive BCG Matrix analysis of Apple’s product portfolio for 2024, we’ve explored how the company’s diverse offerings are positioned within the marketplace.
It’s important to note that this analysis represents a limited snapshot in considered factors (market share and market growth) and time (2024).

3 Comments