Product portfolio is always expanding …
It can be challenging to decide where to focus your marketing efforts and budget when managing a diverse range of products. It becomes complex, especially when trying to determine which ones are performing well and which ones might need more attention.
Instead of making decisions based on guesswork, you have tools available that can provide clear insights into your product portfolio’s performance.
If you need a current “snapshot” of how each product is performing right now, the Boston Consulting Group (BCG) Matrix can offer a more immediate analysis.
In this article, I’m going to tell you;
- What is the BCG Matrix?
- Two Key Factors of the BCG Matrix
- Four Quadrants of BCG Matrix
- Advantages of BCG Matrix
- BCG Matrix and the Product Life Cycle
- Limitations of BCG Matrix
- Points of Criticism on BCG Matrix
- The Takeaway
Let’s get started.
Did you know: In 2011, the BCG Matrix was selected by Harvard Business Review as one of the five charts that “changed the world”. (Source)
What is the BCG Matrix?
The BCG Matrix, also known as the Growth-Share Matrix, was developed in 1970 by Bruce Henderson and the Boston Consulting Group. It is defined as;
A structured planning tool for businesses that visually organizes company’s products into categories to help them decide which products to invest in and which to rethink.
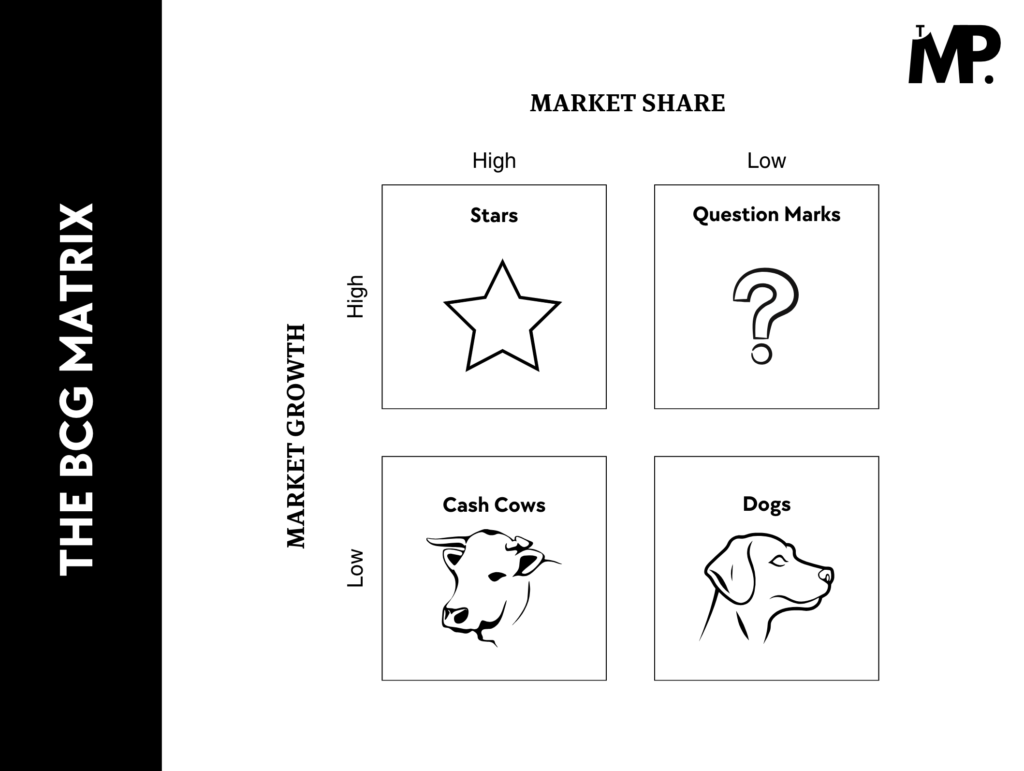
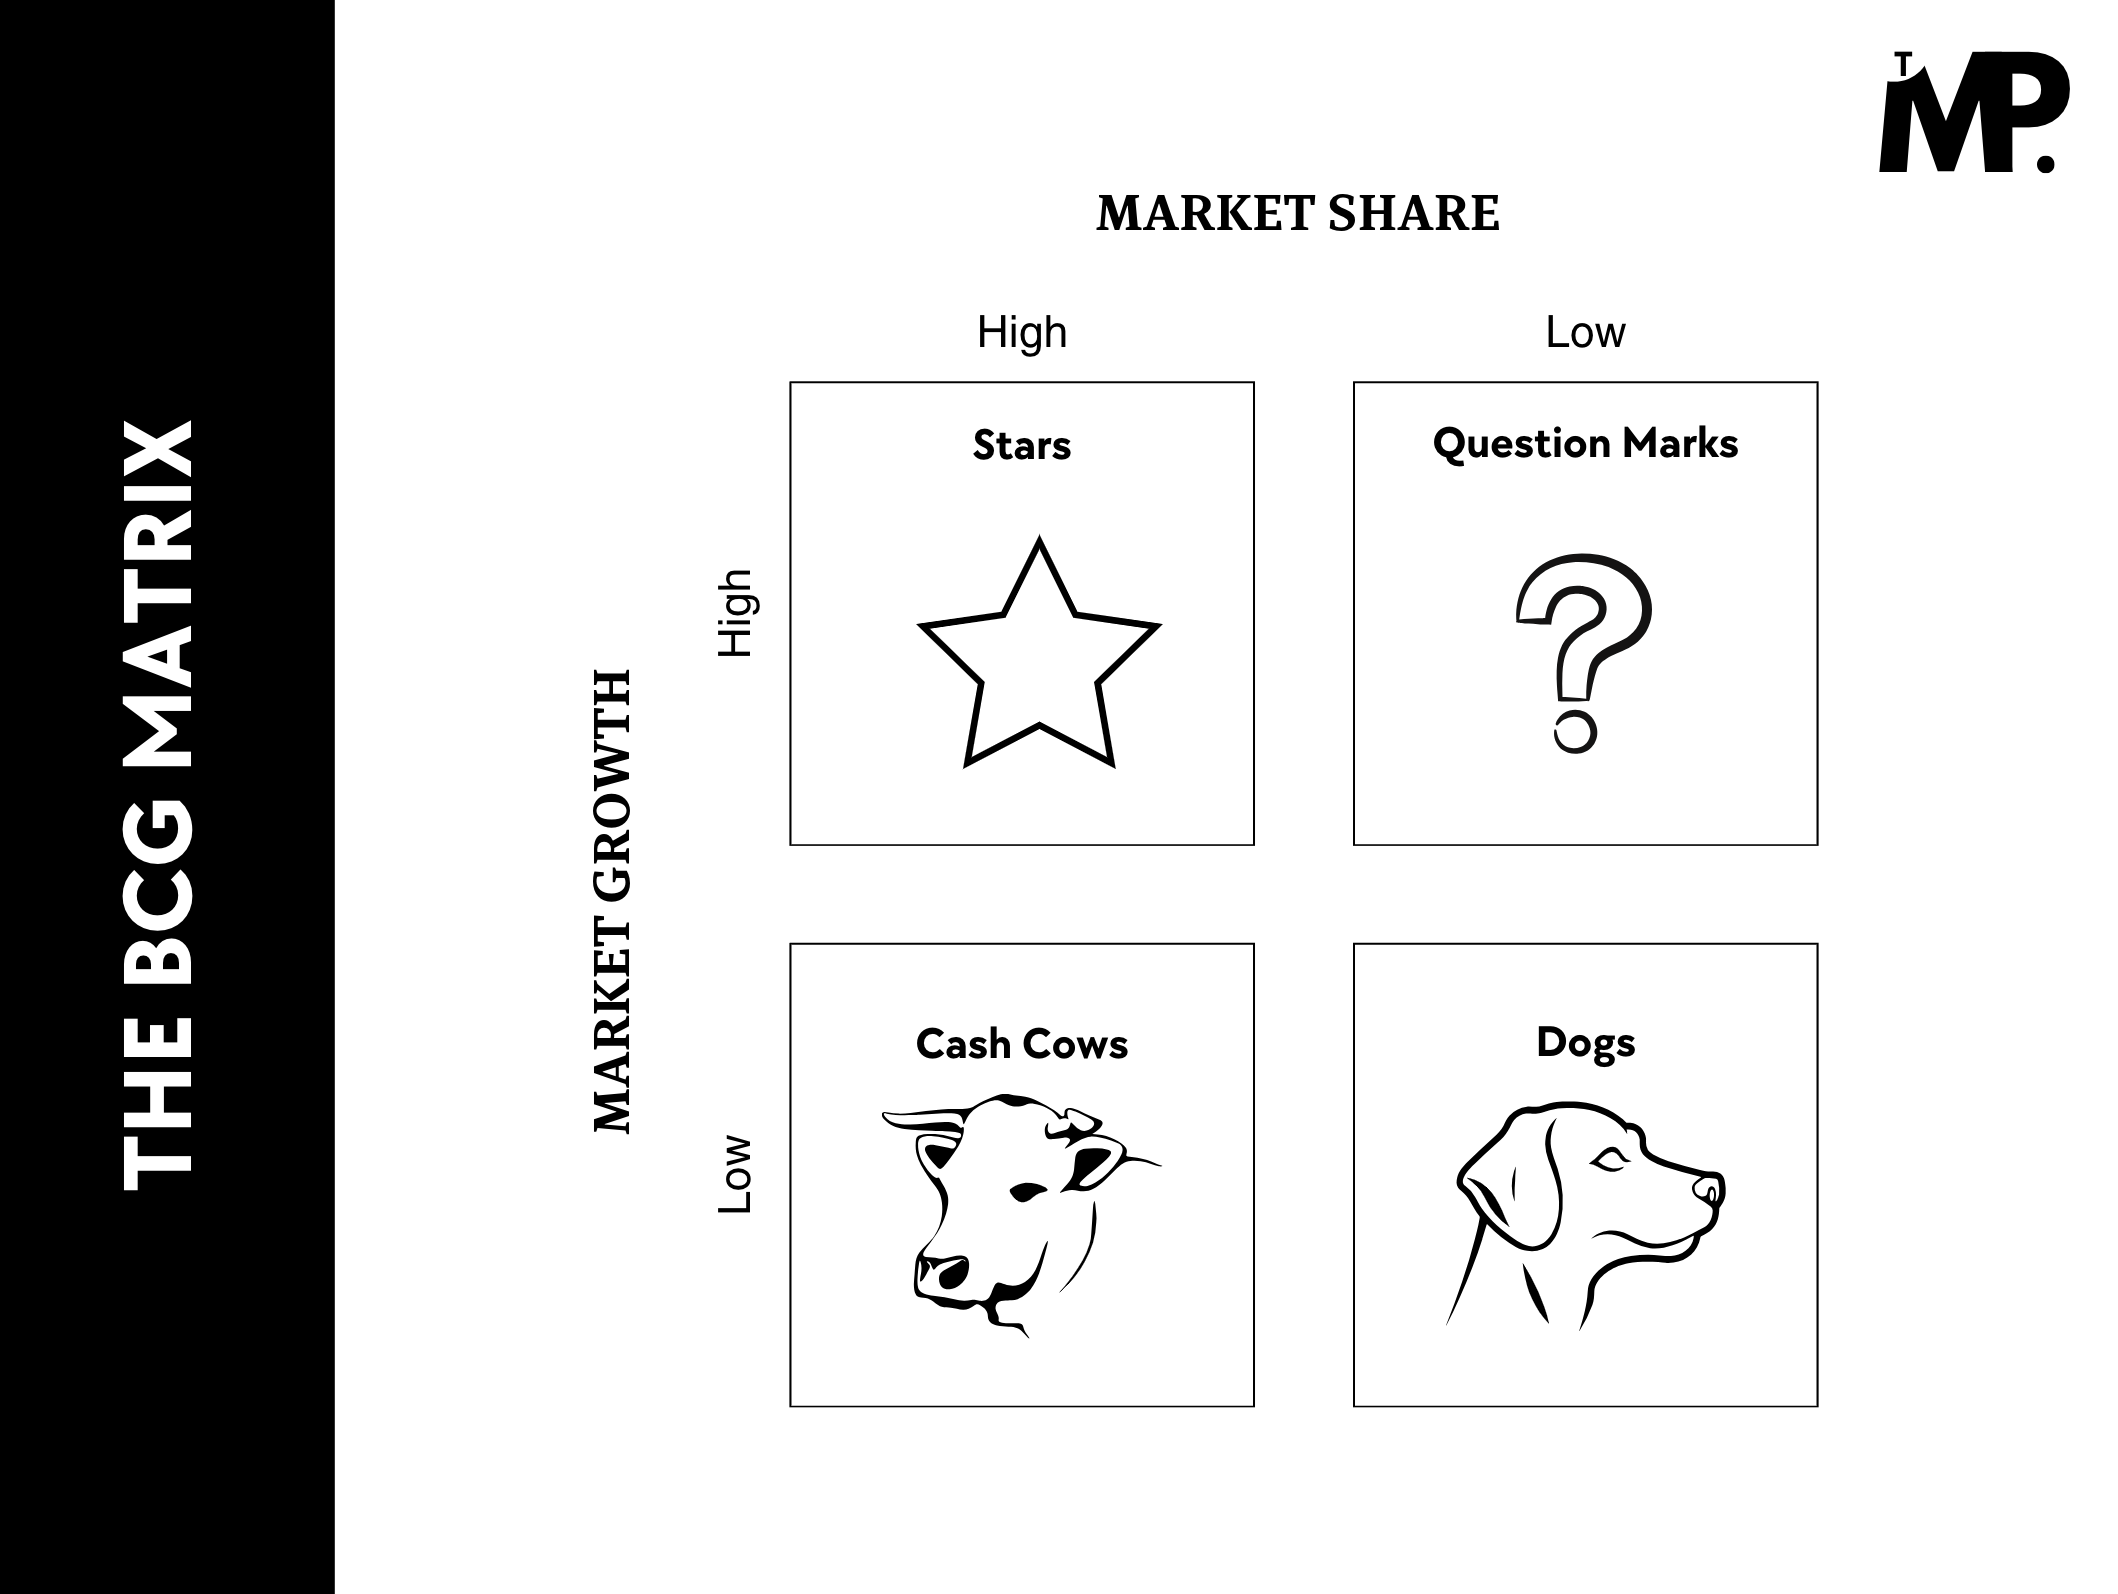
It is a 2×2 grid to categorize products based on their market performance. It evaluates each product according to two key factors:
- Market growth
- Market share
The BCG Matrix helps to classify different products into four main categories;
- Stars
- Question Marks
- Cash Cows
- Dogs
Also Read: How to Create a BCG Matrix [Step by Step Guide + Example]

Two Key Factors of the BCG Matrix
To completely understand the BCG Matrix, you need to know what key factors play a huge role in the findings.
Market Growth
It is a measure of how quickly the market for a product is expanding. It is often expressed as a percentage increase in sales or demand over a specific period.
High market growth indicates that the market is rapidly increasing, while low market growth suggests a slower rate of expansion.
The vertical axis (x-axis) of the matrix is labelled as “Market Growth Rate” .
Market Share
It is the percentage of total sales or revenue in a market that is generated by a specific product or company compared to its competitors.
A high market share means a product or company has a significant portion of the market, while a low market share indicates a smaller presence.
The horizontal axis (y-axis) of the matrix is labelled as “Market Share”.
Four Quadrants of BCG Matrix
The BCG Matrix divides a company’s products or business units into four distinct categories. Each quadrant represents a different combination of market share and market growth.
Here’s a detailed look at each of the four quadrants:
1. Stars – Leading
High market share and high market growth
“Stars” are the products that hold a dominant position in a rapidly expanding market.
They are the leaders in their field and benefit from high customer demand. Just because the market is growing, these products are highly profitable.
Why do products fall in the “stars” category?
There are 3 reasons for the products to be “star” are;
- They have strong sales and significant market share.
- The market is expanding, which means there are opportunities for continued growth.
- They require ongoing investment to maintain their competitive edge.
Example
The Apple Smartwatch is a perfect example of a Star. Apple dominates the smartwatch market, which is growing rapidly as consumers increasingly seek smart, wearable technology. The company continues to invest in new features and marketing to maintain its leadership.
Regularly invest in Stars to ensure they remain competitive and capitalize on the market’s growth potential. This will help them transition to Cash Cows as the market matures.
2. Question Marks – Potential
Low market share and high market growth
‘Question Marks’ are products that are in an uncertain position. These products have the potential to become Stars if they can increase their market share, but the process requires careful analysis and good amount of investment.
The key challenge is to determine whether the potential benefits of investing in these products outweigh the risks.
Why do products fall in the “Question Mark” category?
There are 3 reasons for the products to be “question marks”;
- The market is expanding which means they have opportunities for growth
- The product has yet to capture a significant portion of it.
- They require investment to improve their market position.
Example
A new electric scooter model from a startup company could be a Question Mark. The electric scooter market is rapidly growing, but the new model has not yet established a significant presence compared to established brands.
Evaluate Question Marks carefully to decide if further investment is likely to yield positive results or if the product should be phased out.
3. Cash Cows – Profitable
High market share and low market growth
“Cash Cows” are the products that have matured and the growth is already declining in the market. They are highly profitable and generate more cash than is needed to maintain their market position. They are stable and reliable sources of income.
The extra revenue can be used to fund other areas of the business, such as investing in Stars or supporting new initiatives. Cash Cows are stable and reliable sources of income.
Why do products fall in the “Cash Cows” category?
There are 3 reasons for the products to be “cash cows” are;
- They dominate their market and are well-organized.
- The market is not growing significantly but the product continues to generate steady revenue.
- They require minimal investment to maintain their position.
Example
A classic example of a Cash Cow might be the original Coca-Cola drink. It has a strong market position and continues to generate revenue in a mature beverage market. The profits from Coca-Cola can support the development of new products and investments in other areas.
Cash Cows are crucial for funding the growth of Stars and Question Marks. They provide the financial stability necessary for strategic investments and innovation.
4. Dogs – Struggling
Low market share and low market growth
“Dogs” are products that are not growing in all contexts. These products typically struggle to generate significant revenue and may not have much potential for future growth. They drain on the resources and may not justify continued investment.
Why do products fall in the “Dogs” category?
There are 3 reasons for the products to be “dogs” are;
- They do not perform well financially.
- The market is either stagnant or declining, which limits growth opportunities.
- They often consume resources without providing substantial returns.
Example
An example of a Dog might be an outdated typewriter in the digital age. The market for typewriters is virtually non-existent, and the product has very little demand or market share. It may be more efficient to discontinue it and reallocate resources.
Regularly review Dogs to decide if they can be improved or should be phased out. Often, discontinuing Dogs can free up resources for more promising products.
Overview:
| Star | Question Mark |
| Stars have the potential to become the company’s primary revenue generators. They can eventually transition to the “Cash Cows” quadrant with continued investment. – High market share – High market growth Investment Consideration (Necessary): High investment is crucial to maintain their competitive edge. | The future of Question Marks is uncertain. They have potential but need careful strategic planning. They could become Stars with the right investment or fail to gain traction and be phased out. – Low market share – High market growth Investment Consideration (Selective): Investment decisions should be based on potential market opportunities and strategic fit. |
| Cash Cow | Dog |
| Cash Cows are stable and provide consistent cash flow. They typically don’t require significant investment but should be managed efficiently. – High market share – Low market growth Investment Consideration (Minimal): Minimal investment is needed to maintain the current market share and profitability. | Dogs are unlikely to grow and can drain resources without providing substantial returns. They may be candidates for divestiture or discontinuation. – Low market share – Low market growth Investment Consideration (Low or None): Limited investment is generally advised. Resources should be redirected to more promising areas. |
The BCG Matrix gives managers what Allio (2006) refers to as “notorious resource allocation prescriptions” for handling resources. This means: milk the cows, divest the dogs, invest in the stars, and analyze the question marks.
| You can also read the BCG Matrix Analysis of companies i.e. BCG Matrix of Amazon BCG Matrix of Apple BCG Matrix of NVIDIA BCG Matrix of Nike BCG Matrix of Meta BCG Matrix of Sony BCG Matrix of Google |
Advantages of BCG Matrix
The key advantages of using the BCG Matrix are:
- The BCG Matrix is simple and straightforward to use.
- The quadrant style makes it easier to see where each product stands.
- It guides how to divide resources among different products.
- It helps understand the relationship between market trends and product success.
BCG Matrix and the Product Life Cycle
The stage of a product’s life cycle is closely tied to its placement in the BCG Matrix. By studying a product’s lifecycle phase—whether it’s in introduction, growth, maturity, or decline—you can better interpret its position and performance within the matrix.
The Product Life Cycle describes the stages a product goes through from it’s introduction to its decline. The stages are;
- Introduction: Sales are low and growth is slow.
- Growth: Sales increase rapidly as the product gains market acceptance.
- Maturity: Sales growth slows as the product reaches widespread acceptance.
- Decline: Sales and market interest decrease as newer products come.
How BCG Matrix and Product Life Cycle Relate?
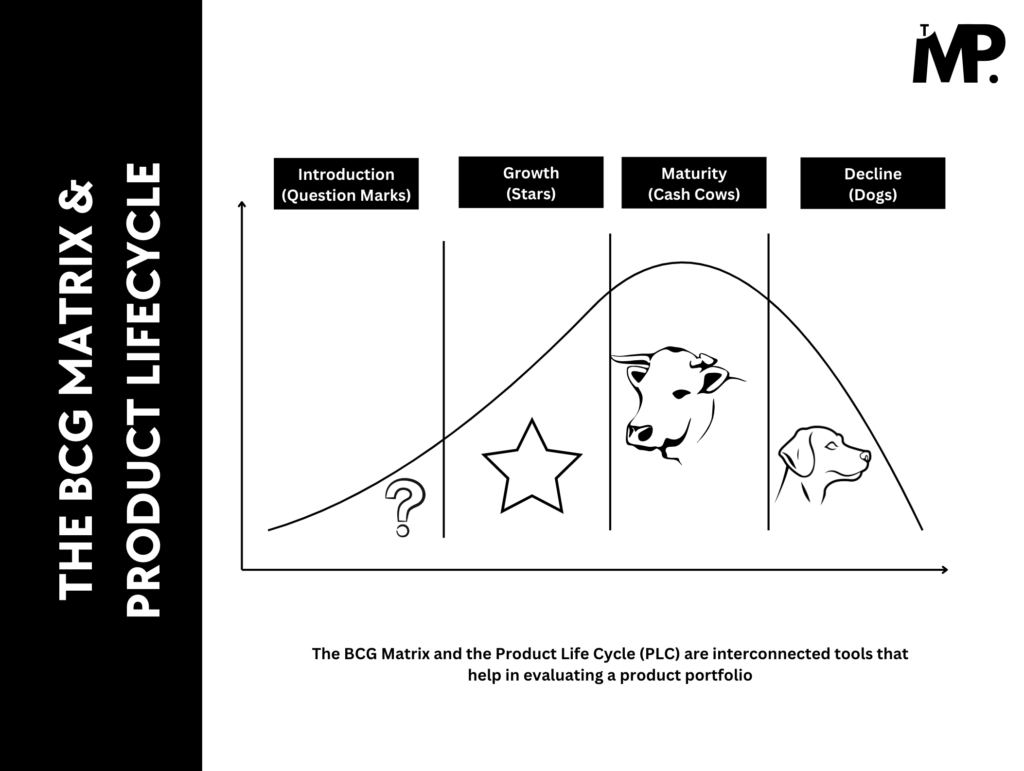
The BCG Matrix and the Product Life Cycle (PLC) are interconnected tools that help in evaluating a product portfolio.
See this image below, you can observe how each stage of the Product Life Cycle correlates with a specific quadrant in the BCG Matrix;

1. Introduction Stage and Question Marks
When a product is launched, it typically falls into the Introduction Stage of the PLC. During this phase, it is often categorized as a Question Mark in the BCG Matrix.
Since the product is new, it generally has a low market share. However, the market it operates in is growing rapidly, which aligns with the characteristics of Question Marks.
2. Growth Stage and Stars
During the Growth Stage of the Product Life Cycle (PLC), a product begins to gain traction in the market and experience increasing sales. At this point, it often aligns with the “Stars” quadrant in the BCG Matrix. As stars are characterized by;
- high market share
- high market growth
3. Maturity Stage and Cash Cows
As a product reaches the Maturity Stage of the Product Life Cycle (PLC), it typically begins to stabilize in terms of sales and market presence. At this stage, it often corresponds to the “Cash Cows” quadrant in the BCG Matrix.
The market is no longer expanding rapidly but the product holds a dominant position in its market. Growth rates have plateaued, and the focus shifts to maintaining profitability rather than pursuing aggressive expansion.
4. Decline Stage and Dogs
As a product enters the Decline Stage of the Product Life Cycle (PLC), it faces reduced sales and market relevance. At this point, it often aligns with the “Dogs” quadrant in the BCG Matrix.
This phase is characterized by a significant drop in sales. The product may face obsolescence due to new technologies or any other reasons. The market is shrinking, and maintaining profitability becomes challenging.
- The BCG Matrix can help decide how much to invest in “Question Marks” to turn them into “Stars”.
- The PLC stage also indicates that heavy investment is needed during the Introduction and Growth stages.
- Moreover, “Cash Cows” are products that generate steady revenue with minimal investment, aligning with the PLC’s Maturity stage.
- For products in Decline, the Matrix helps decide whether to continue investing or phase them out.
Limitations of BCG Matrix
While the BCG Matrix offers valuable insights into product performance, it also has several limitations that can affect its accuracy and applicability.
Oversimplification
The BCG Matrix simplified complex market and product dynamics into just two dimensions i.e. market share and market growth. This oversimplification may overlook other critical factors like profitability, market trends, competitive landscape, and external influences.
Static Nature
The Matrix provides a snapshot of market performance at a particular point in time. Markets and product performance are ever-changing. It makes matrices less useful for long-term planning.
Focus on Market Share
The Matrix places heavy emphasis on market share as a key indicator of success. Market share doesn’t always correlate with profitability. Moreover, high market share alone doesn’t guarantee financial success.
Lack of Strategic Depth
It doesn’t provide detailed strategic guidance beyond categorizing products. Businesses need more nuanced strategies to address specific challenges and opportunities not covered by the Matrix.
Points of Criticism on BCG Matrix
The BCG Matrix, despite its popularity, has faced significant criticism from academic researchers and practitioners over the years. Here’s a summary of the main criticisms and who raised them:
Reductionist – Henry Mintzberg, Bruce Ahlstrand, and Joseph Lampel
In the book named “Strategy Safari: A guided tour through the wilds of strategic management“, written by Henry Mintzberg, Bruce Ahlstrand, and Joseph Lampel, they criticized BCG matrix for being reductionist on pp 96-97.
The comment they made is it is overly simplistic, relying on just two dimensions (market share and market growth) to categorize products. This simple approach doesn’t capture the full complexity of business situations.
Over-simplification – Peter Stearns and Margaret C. Brindle
In their book “Facing up to Management Faddism: A New Look at an Old Force“, Peter Stearns and Margaret C. Brindle argue that the BCG Matrix’s simplicity might lead to shallow analysis. They describe it as “a simple tool for a pretty tall order” (p. 119), meaning that while it’s easy to use, it doesn’t address deeper, more complex issues.
Mechanistic Approach – Wilson, I.
In the article “Strategic Planning Isn’t Dead—It Changed“, published in Long Range Planning, the BCG Matrix is criticized for being too rigid. It offers a fixed framework that may not work well in fast-changing business environments. Critics say that using only this tool might overlook the complexities and changes in today’s markets.
Too General – (Robert P. Wright, Sotirios Paroutis, and Daniela Blettner)
In the article named “How useful are the strategic tools we teach in business schools?” written by Robert P. Wright, Sotirios Paroutis, and Daniela Blettner, published in Journal of Management Studies.
The BCG Matrix is often criticized for being too general in pp. 92-125. They said that;
- “It is too generic/cannot help users to focus on the problem
- It do not provide a clear picture of different areas
- It do not guide users to form good thinking path
- It do not help users to think about the company’s value
- and are considered too broad”
These criticisms highlight various concerns regarding the BCG Matrix’s effectiveness.
The Takeaway
As you manage your growing list of products, the BCG Matrix can help you see how well each product is doing and guide where to invest your resources.
Here’s what you can do with the BCG Matrix and what to keep in mind:
- Use the BCG Matrix to get a quick snapshot of your products’ current performance. This will help you decide where to focus your marketing efforts and budget.
- Since markets and product performance can change rapidly, update your BCG Matrix regularly to reflect the latest data.
- Allocate resources based on the Matrix’s findings.
- Invest in Stars to maintain their growth
- Support Question Marks with potential
- Use Cash Cows for funding
- Consider phasing out Dogs if they no longer contribute positively.
- Remember that the BCG Matrix is a simplified tool. It doesn’t capture all market complexities or provide detailed strategic insights.
- Stay flexible and adjust your strategies as needed based on broader market observations.
Be mindful of its limitations.

22 Comments