The BCG Matrix is a simple way to analyze how a company’s products are performing in the market.
For Disney, it helps us see which areas, like blockbuster movies, theme parks, or streaming platforms, drive growth and profits, and which need improvement.
This tool shows how Disney balances its creative offerings while staying competitive in the fast-changing entertainment industry by fitting into
- Stars
- Cash Cows
- Question Marks
- Dogs.
Overview of Disney
The Walt Disney Company, founded in 1923, is a global leader in the media and entertainment industry. With operations in 40 countries, Disney offers a diverse portfolio, including theme parks, films, television networks, streaming services like Disney+, and consumer products. Its reputation for innovation and storytelling has made it a household name worldwide.
Under the leadership of Chairman Mark Parker and CEO Bob Iger, Disney reported $88.93 billion in revenue in 2023. The company employs 225,000 people and competes with major players like Netflix and Sony.
BCG Matrix Analysis of Disney
To really understand where Disney stands in the market, marketers and business strategists need to look closely at how the company is positioned using the BCG Matrix.
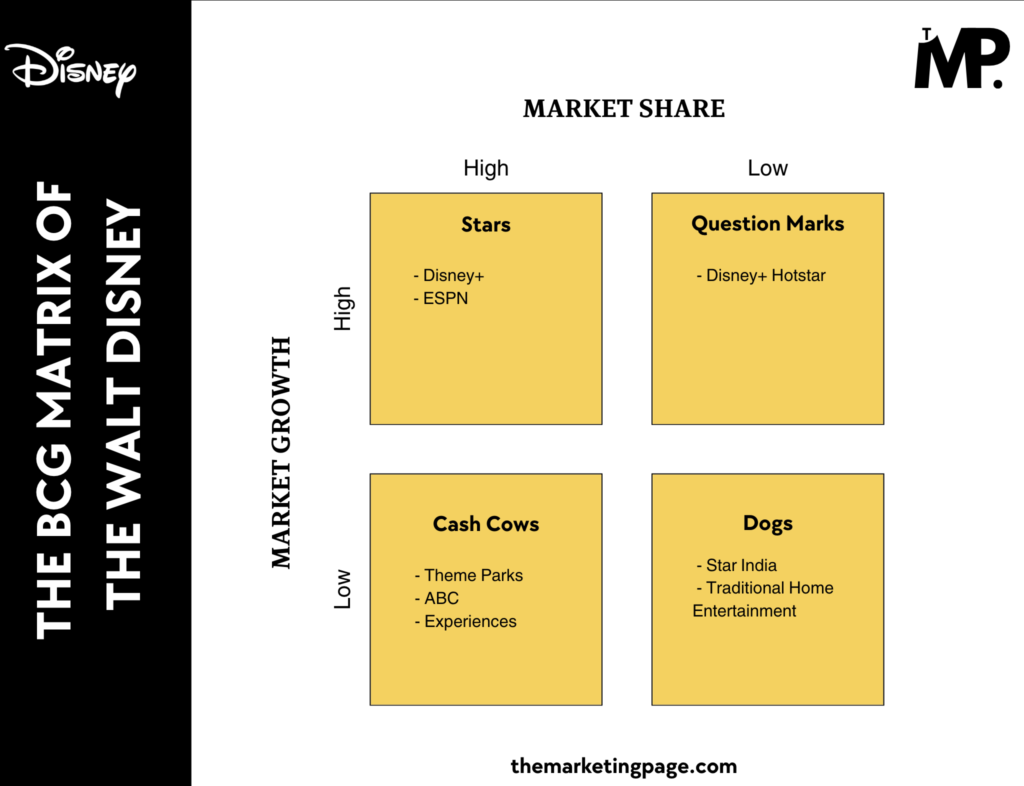
See the matrix below;

1. Stars (High Market Share, High Market Growth)
Key Products: Disney+, ESPN
Disney+ and ESPN+ are the standout stars in Disney’s portfolio, driving growth in the booming streaming market.
Disney+ has surpassed 158.6 million subscribers globally as of FY2024. Its success is fueled by exclusive franchises like Star Wars, Marvel, and Pixar, alongside international expansion into regions like Europe, Latin America, and Asia-Pacific.
Similarly, ESPN+ benefits from the rising demand for live sports streaming, with over 25.6 million subscribers in FY2024. Key partnerships, such as exclusive rights to the NFL and UFC, boost its market share.
Disney’s ongoing investment in premium content, regional programming, and bundling strategies (e.g., the Disney Bundle) ensures these platforms remain leaders in high-growth markets.
2. Cash Cows (High Market Share, Low Market Growth)
Key Products: Theme Parks, ABC
Disney’s theme parks and ABC network are established cash cows that provide steady revenue streams.
The theme parks division, which includes iconic locations like Disneyland and Walt Disney World, reported $34.15 billion in revenue in FY2024. Despite the mature theme park market, Disney maximizes profitability through innovations like Genie+ (a paid service for queue management) and immersive experiences such as Star Wars: Galaxy’s Edge.
ABC, one of the leading television networks in the U.S., generates consistent advertising revenue, with hit shows like Grey’s Anatomy and The Bachelor attracting audiences.
Both assets provide Disney with reliable profits.
3. Question Marks (Low Market Share, High Market Growth)
Key Products: Disney+ HotStar
Disney+ Hotstar is a prime example of a question mark, performing well in a high-growth market like India but facing challenges in monetization.
With over 35.9 million subscribers, it dominates streaming in India, driven by its exclusive rights to popular cricket tournaments like the IPL. However, its reliance on ad-supported revenue and competitive pricing pressures from rivals like Amazon Prime and Netflix impact profitability.
To transform Hotstar into a star, Disney is exploring localized content and higher subscription tiers alongside expanding into Southeast Asian markets.
Strategic focus on improving average revenue per user (ARPU) and reducing dependency on sports rights could unlock its full potential.
4. Dogs (Low Market Share, Low Market Growth)
Key Products: Star India, traditional home entertainment
Star India and traditional home entertainment represent Disney’s underperforming assets.
Star India, once a leading TV network in India, has faced declining viewership due to the shift toward digital streaming.
Similarly, traditional home entertainment, including DVD and Blu-ray sales, has plummeted as consumers embrace streaming platforms. For example, global physical media sales are falling because of the streaming platforms. This highlights the decline of this market.
Disney may consider phasing out or integrating these products with digital platforms to align with changing consumer habits and optimize resource allocation
Conclusion
By understanding where each product falls in the matrix—whether as a Star, Cash Cow, Question Mark, or Dog—The Walt Disney can make informed decisions.
- Stars like Disney+ and ESPN+ drive growth in high-demand markets.
- Cash cows like theme parks and ABC sustain profitability.
- Question marks such as Disney+ Hotstar present untapped potential requiring strategic investment.
- Dogs like Star India and traditional home entertainment call for restructuring.
BCG Matrix can be a guide for making smart, data-driven decisions that will allow the company to continue leading the entertainment market for years to come.
Note: It’s important to note that this analysis represents a limited snapshot in considered factors (market share and market growth) and time (2024).

1 Comment