The sports industry is always changing, with new trends and technology coming out all the time.
It gets necessary to get snapshot of which products are doing well in the market.
Nike, a global leader in sportswear, can use the BCG Matrix to gain a clear understanding of how its key product lines—shoes, clothing, and sports gear—are performing in the ever-evolving market.
By examining Nike’s products through the lens of the BCG Matrix, we can categorize them into four distinct groups:
- Stars
- Cash Cows
- Question Marks
- Dogs
This method provides Nike with a clear picture of which products are leading the market, which ones are experiencing steady growth, and which may be losing their competitive edge.
Overview of Nike ✔
Nike,Inc. is one of the world’s leading brands in athletic apparel, footwear, and sports equipment. Founded in 1964 by brothers Bill Bowerman and Philip Knight, Nike has grown from a small distributor of running shoes to a global powerhouse in sportswear.
Today, Nike operates in over 170 countries and employs approximately 79,400 people (FY2024). Its extensive product line includes athletic shoes, apparel, sporting goods, and accessories, serving a wide range of sports and lifestyle needs. Nike’s brand portfolio also includes popular sub-brands like Jordan and Converse, helping the company maintain its leadership in the sports industry.
Financially, Nike generated $51.36 billion in revenue for FY2024, with a net income of $5.7 billion. Under the leadership of CEO John Donahoe and Executive Chairman Mark Parker, Nike continues to drive growth through innovation, sustainability initiatives, and direct-to-consumer strategies.
BCG Matrix Analysis of Nike
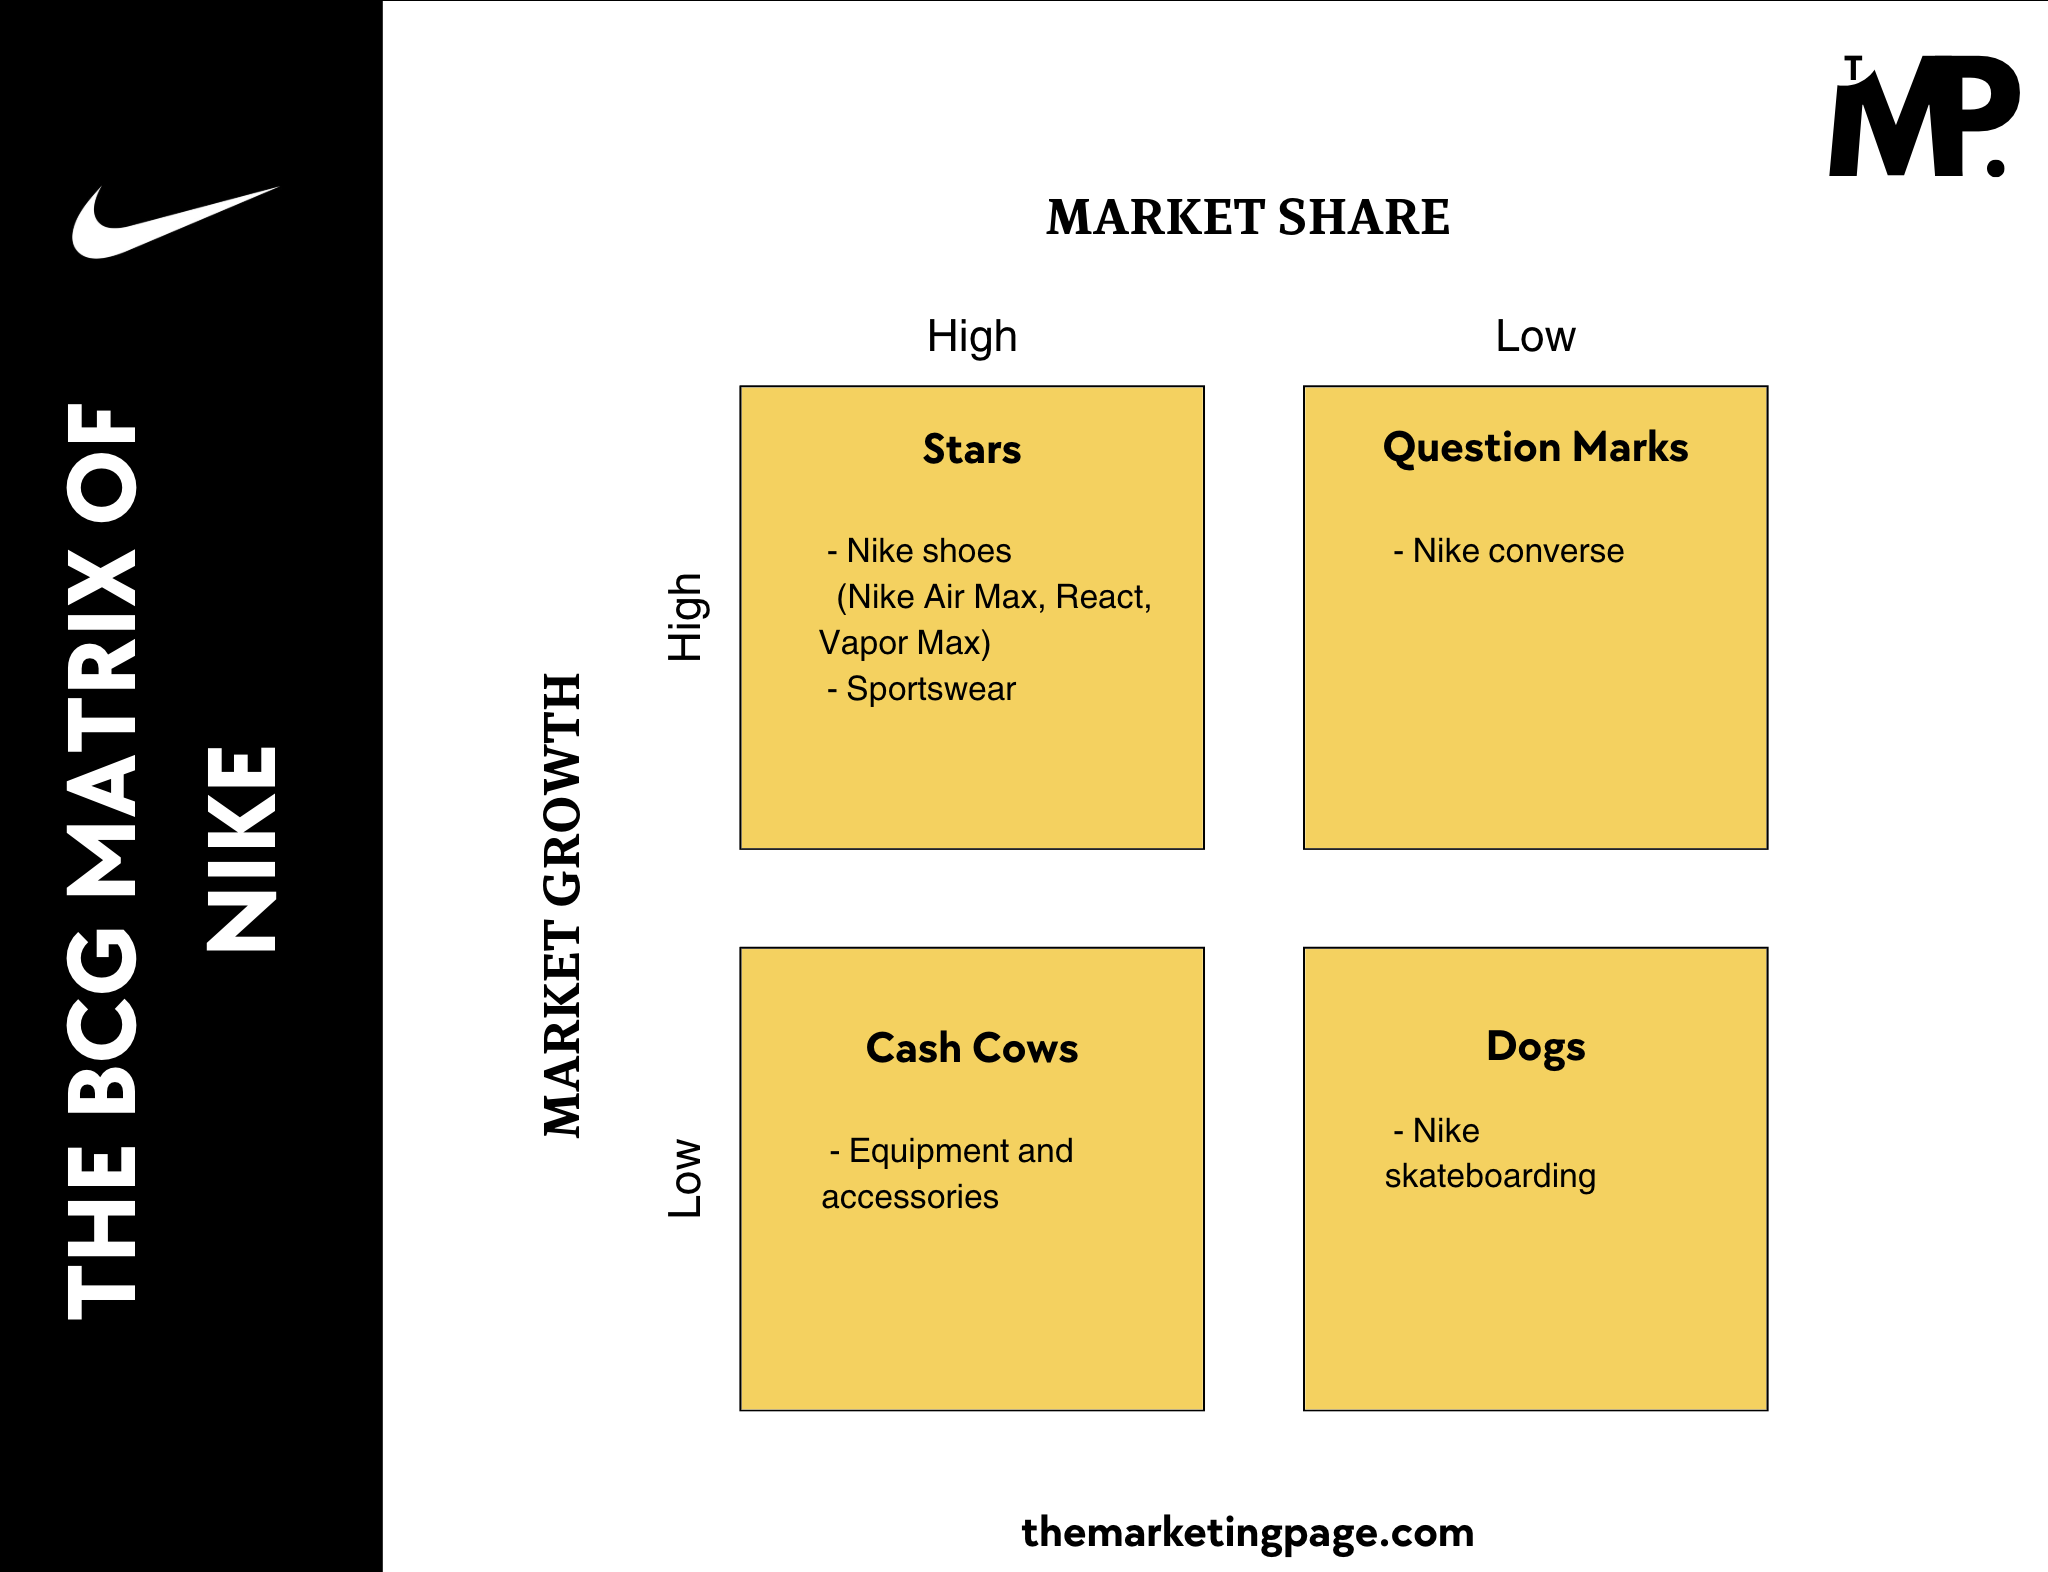
To really understand where Nike stands in the market, marketers and business strategists need to look closely at how the company is positioned using the BCG Matrix. See the matrix below;

Stars (High Market Share, High Market Growth)
Key Products: Nike Shoes (Nike Air Max, React, Vapor Max)
Nike’s shoes, such as the popular Nike Air Max, React, and Vapor Max, are considered Stars in the BCG Matrix.
Nike’s footwear revenue increased by approximately 0.87% from 2023 ($33.14 Billion) to 2024 ($33.43 Billion). (Source: Statista)
Nike constantly innovates with new styles, features, and technologies to meet the demands of athletes and sneaker enthusiasts alike. The continuous demand and market expansion make these products essential drivers of revenue for Nike.
Strategic Recommendations:
- Keep introducing new designs and technologies.
- Availability expansion in more regions will generate more revenue.
- Offer exclusive releases to loyal customers using personalized marketing.
- Maintain premium pricing while offering value through quality and unique features.
2. Cash Cows (High Market Share, Low Market Growth)
Key Products: Nike Equipment and Accessories
Nike’s equipment and accessories, including items like sports gear, socks, and bags, fall under the Cash Cow category.
It is because they saw 15% increase in revenue from 2023 to 2024, as detailed in Nike’s financial statement.
While the demand for sports equipment may not be as high as for shoes, these products have a significant market share and continue to bring in consistent cash flow.
Nike has strategically positioned these products as must-have accessories for athletes by using endorsements from celebrities like Travis Scott to maintain their dominance.
Strategic Recommendations:
- Keep costs low to maintain strong profits.
- Keep partnering with celebrities to stay popular
3. Question Marks (Low Market Share, High Market Growth)
Key Products: Nike Converse
Nike’s Converse brand falls under the Question Mark quadrant.
Converse experienced a 14.2% decline in revenue from 2023 ($2,427 Million) to 2024 ($2,082 Million) which indicates that it has low growth. (Source: Statista)
Although Converse has a long history and some brand loyalty, it faces challenges in a competitive market where newer and more trendy brands like Adidas and Vans have a strong presence.
While there is still high market growth potential in the footwear industry, Converse has yet to gain significant market share, and its future is uncertain.
Strategic Recommendations:
- Focus on product differentiation and innovation. Launch unique designs and eco-friendly products to appeal to younger, conscious consumers.
- It is good to refresh Converse’s image to engage younger audiences through targeted digital campaigns and influencer partnerships.
- Enter emerging markets with less competitor presence to capture new growth opportunities.
- Streamline product lines by reducing unprofitable items to sharpen focus and boost profitability.
4. Dogs (Low Market Share, Low Market Growth)
Key Products: Nike SB (Skateboarding)
The Nike SB (Skateboarding) line is placed in the Dog quadrant.
While Nike SB has a dedicated following, it has struggled to capture a significant portion of the skateboarding market compared to rivals like Vans and Santa Cruz.
The skateboarding community primarily supports other brands, and Nike SB hasn’t been able to compete at the same level in this market. Although Nike did a brief relaunch of some Nike SB models like the Zoom Stefan Janoski OG, the product still faces challenges in regaining significant market share.
As a result, it remains in the Dogs category, with minimal market growth and profitability.
Strategic Recommendations:
- Stick to the niche and focus on dedicated skateboard fans.
- Partner with skateboarding influencers to attract interest.
- Invest only a little in low-performing products
Conclusion
By understanding where each product falls in the matrix—whether as a Star, Cash Cow, Question Mark, or Dog—Nike can make informed decisions.
Nike should;
- Invest in stars
- Manage cash cows efficiently
- Re-evaluate question marks
- Evaluate and discontinue dogs (if necessary)
BCG Matrix can be a guide for making smart, data-driven decisions that will allow the company to continue leading the sportswear market for years to come.
Note: It’s important to note that this analysis represents a limited snapshot in considered factors (market share and market growth) and time (2024).

2 Comments