If you’ve read our earlier discussion on the BCG Matrix, you already know how powerful this strategic tool is for analyzing your product portfolio.
It’s like having a bird’s-eye view of your entire product portfolio—but how do you create one?
Let’s break it down step by step.
Step 1: List all of your products
The first step in creating a BCG Matrix is laying a solid foundation by listing all the products or business units you want to analyze.
Here’s how to do it:
- Make a comprehensive list of all the products currently in your portfolio. This ensures no important product is overlooked.
- Group your products by type, category, or business unit if you manage a large portfolio.
- Include both new and established products. Even if a product has just launched or is in the growth stage, it needs to be part of the analysis.
Be as specific as possible. For instance, instead of listing “Snacks,” break it down into individual products like “Potato Chips,” “Protein Bars,” and “Trail Mix.” The more granular your list, the better your analysis will be.
Step 2: Gather data on Market Share
Now that you’ve identified your products, it’s time to gather data about their relative market share.
This is essentially how much of the market your product controls compared to your competitors.
Market share represents the percentage of total sales or revenue in a market that is generated by a specific product or company compared to its competitors.
For market share data,
- Look at sales data for each product within its category.
- Compare your product’s sales figures to the market leader in that category.
To calculate market share in BCG Matrix, you can use the following formula;
Market Share= (Total sales of the company/Total sales of the market) ×100%
OR
Market Share= (Total units sold by the company/Total units sold by the market) ×100%
Where:
- Sales of the Product/Units: The total sales or revenue generated by the specific product or company.
- Total Market Sales: The total sales or revenue of the entire market or industry.
Suppose your company sells 500,000 units of a product in a market where the total units sold by all competitors combined is 2,000,000 units.
By using the formula, you can do the following calculations;
Market Share = (500,000 ÷ 2,000,000) × 100%
Market Share = 0.25 × 100%
Market Share = 25%
This means your company holds a 25% market share for that product in the overall market.
Use reliable sources for data collection, such as industry reports, market research firms, or internal sales records.
Step 3: Gather Data on Market Growth
The next piece of the puzzle is understanding the market growth rate for each product’s category.
This metric tells you how quickly the overall market is expanding and helps you predict future opportunities.
For market growth data, you need to review past sales growth data for each product. This historical perspective is important for understanding how your products have performed over time.
- Check industry reports or government statistics for annual growth rates.
- Calculate the percentage growth rate for the market over a given period (e.g., one year).
To calculate market growth in BCG Matrix, you can use the following formula;
Market Growth Rate= (Sales in Previous PeriodSales in Current Period − Sales in Previous Period ) ×100%
Where:
- Sales in Current Period: The total sales or revenue for the current period.
- Sales in Previous Period: The total sales or revenue for the previous period.
Let’s say the total market sales for a product category were $100 million last year and have grown to $120 million this year.
By using the formula, you can do the following calculations;
Market Growth Rate = (($120 million – $100 million) ÷ $100 million) × 100%
Market Growth Rate = ($20 million ÷ $100 million) × 100%
Market Growth Rate = 0.2 × 100%
Market Growth Rate = 20%
This means the market for this product category has grown by 20% over the given period.
Focus on trends over time. A single year’s growth rate might not be representative, so look at at least 3-5 years of data for better accuracy.
Step 4: Plot the Data (Circles)
With all the necessary data in hand, it’s time to visualize your findings on the BCG Matrix. Here’s how:
1. Create the BCG Matrix Grid with Two Axis
- X-Axis: Represents Market Share (High to Low).
- Y-Axis: Represents Market Growth Rate (High to Low).
2. Decide Circle Sizes
- Use a metric like total sales revenue, profit contribution, or market size to determine the size of each circle.
- Larger circles typically represent products with higher sales or revenue.
3. Place Each Product in the Quadrant
Based on the data, position each product in the appropriate quadrant:
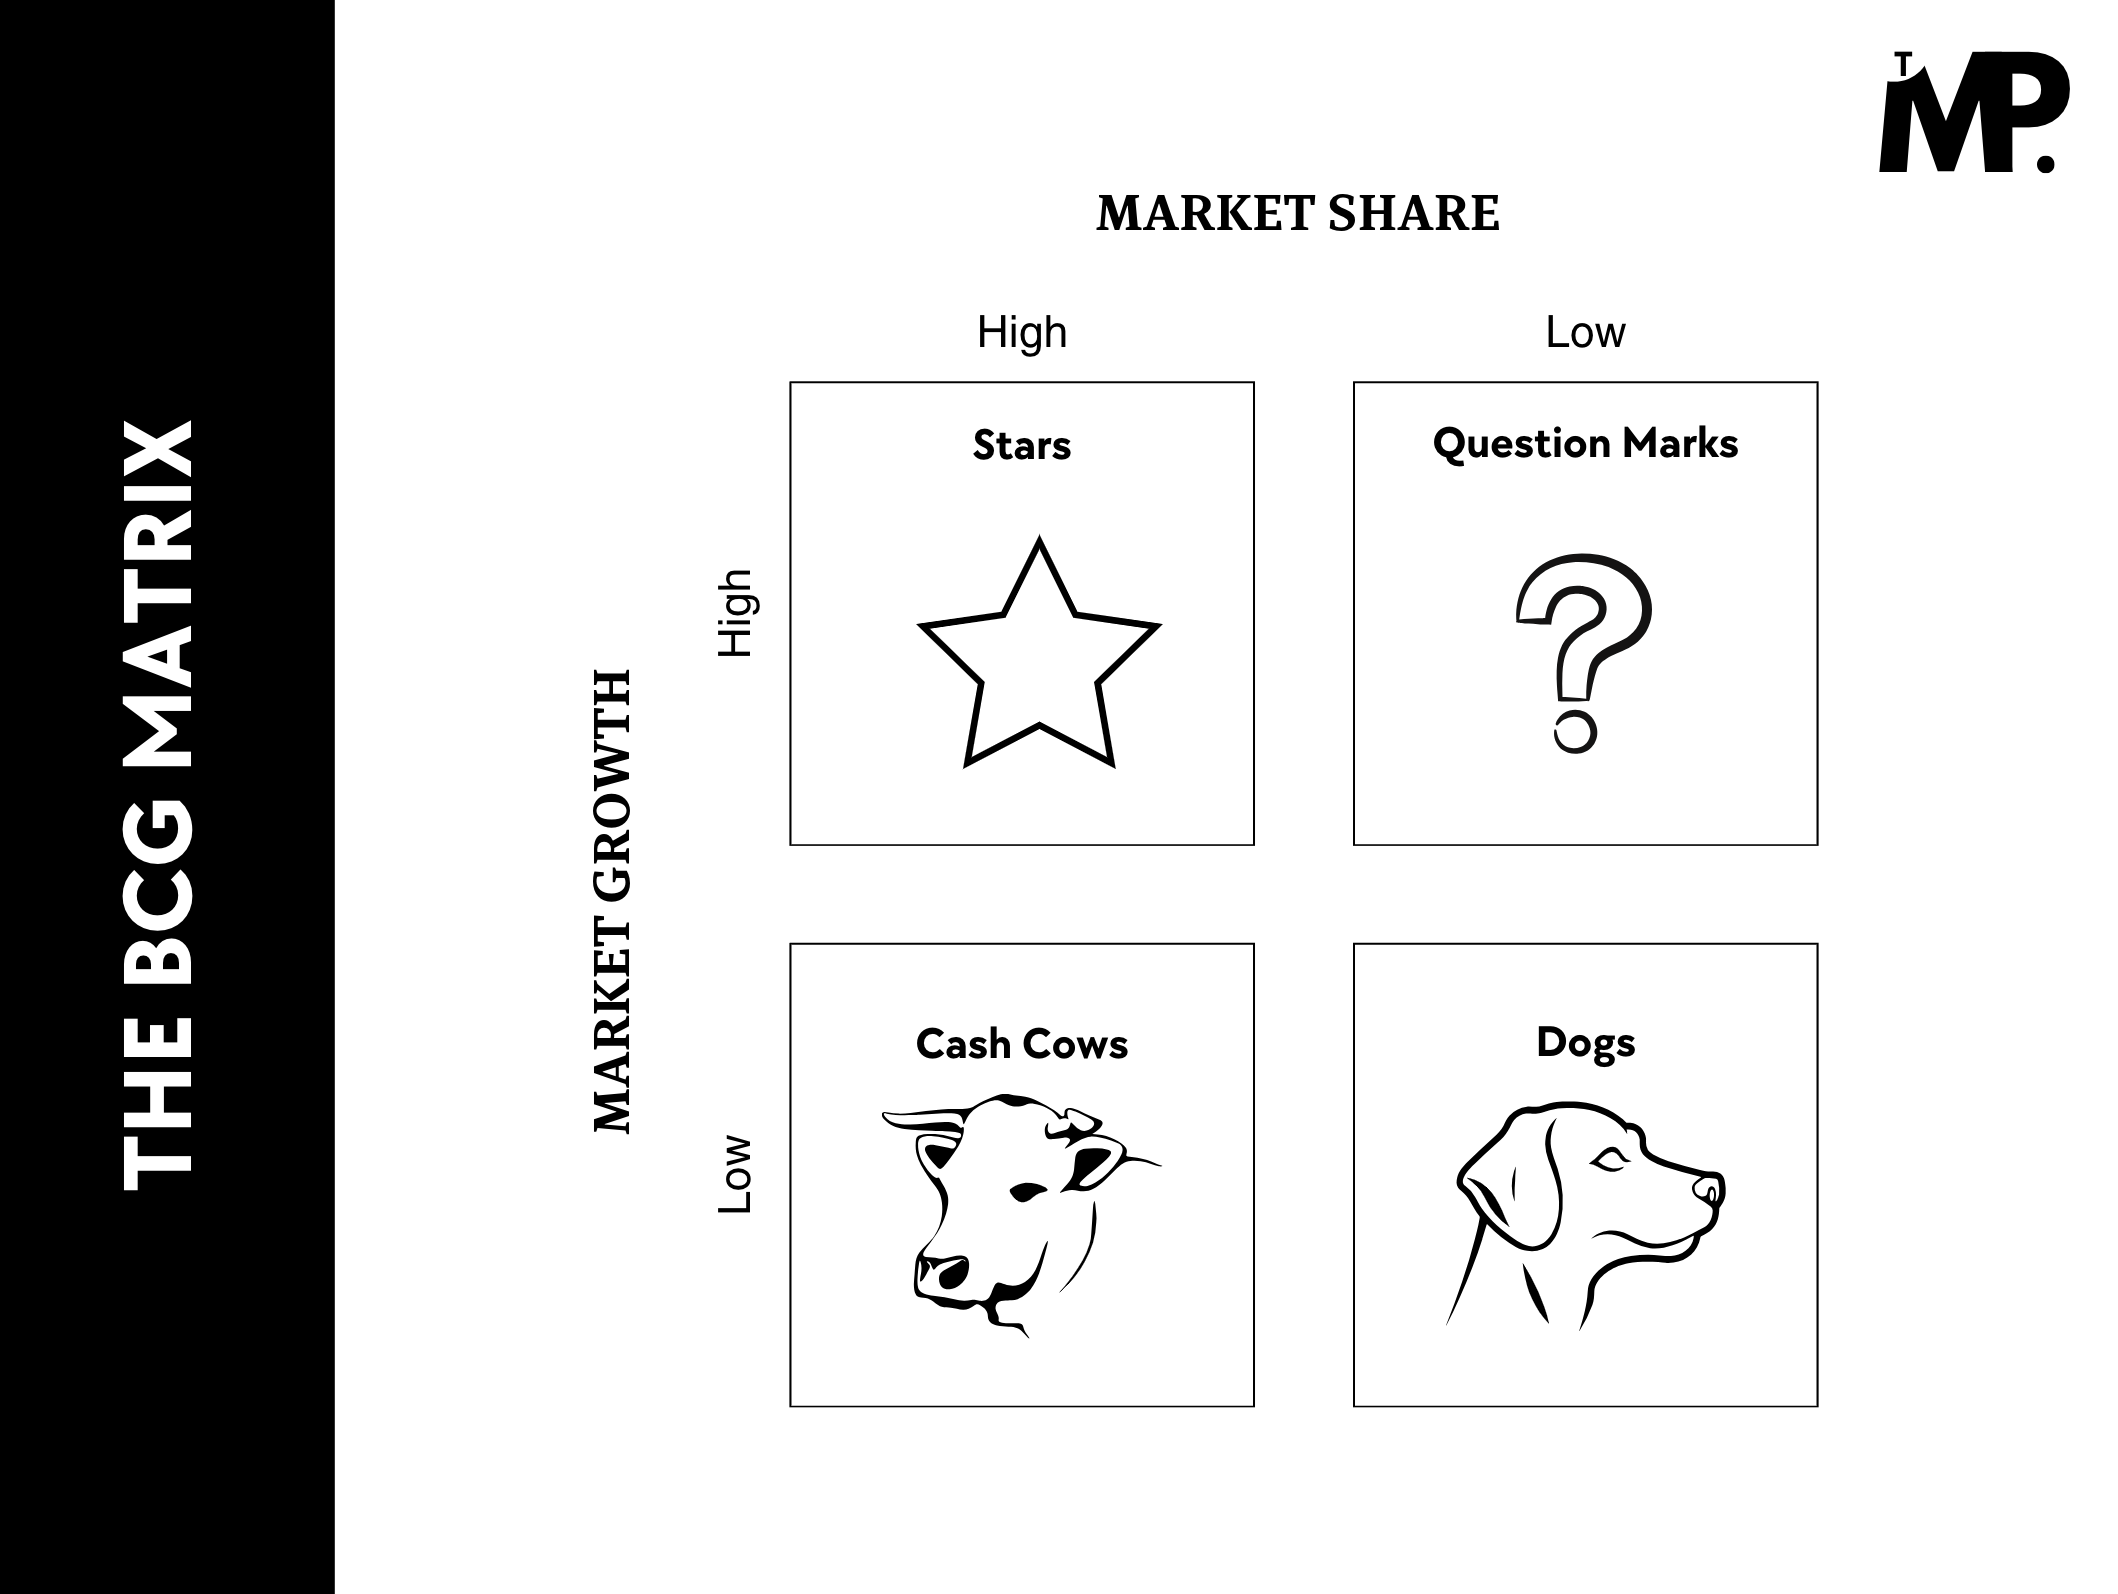
- Stars (Top-Left Quadrant): High market share, high growth rate. These are your growth drivers.
- Cash Cows (Bottom-Left Quadrant): High market share, low growth rate. These products generate consistent revenue.
- Question Marks (Top-Right Quadrant): Low market share, high growth rate. They have potential but need heavy investment.
- Dogs (Bottom-Right Quadrant): Low market share, low growth rate. These are usually candidates for divestment.
4. Resize the Circles
Resize each circle to reflect the chosen metric (e.g., sales revenue). For example, if one product generates $10 million in sales and another generates $5 million, the circle representing the first product should be twice as large as the second.
Label each circle clearly so that stakeholders can quickly identify which product it represents.
Taking Samsung as an example;
I’m taking estimated data from Q1 2024 for each product.
| Product Name | Market Share Owned (%) | Market Share of the Biggest Competitor (%) | Relative market Share (%) | Market Growth (%) |
| Smartphone | 24 | 15.80 | 1.5 | 7.8 |
| TV | 21 | 26 | 0.8 | 2.7 |
| Memory Chips | 43.9 | 31.1 | 1.4 | 7.4 |
| Home Appliances | 21 | 19 | 1.1 | 8.1 |
| Wearable Devices | 10.6 | 20.6 | 0.5 | 8.8 |
| Washing Machine | 20 | 30 | 0.6 | 3.8 |
Samsung Market Share and Market Growth Data for BCG Matrix
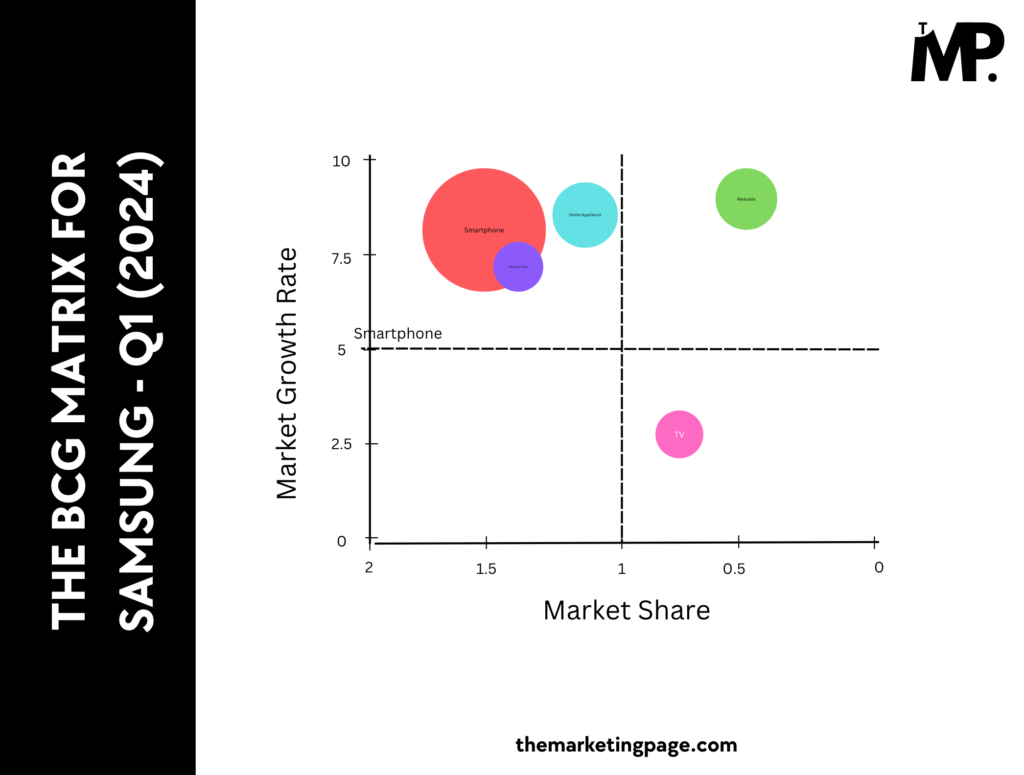
You can see here, I just wanted a snapshot of which Samsung’s products did well in Q1 (2024). It’s for the specific period of time.
Conclusion
Creating a BCG Matrix isn’t just about plotting data; it’s about uncovering insights that drive smarter business decisions. Here are a few final tips:
- The goal of the BCG Matrix is to help you decide where to allocate resources. Use it as a guide to invest in Stars, maintain Cash Cows, nurture Question Marks, and reconsider Dogs.
- Markets evolve. Reassess your BCG Matrix every 6-12 months to stay aligned with market conditions.
- For products in the Question Marks quadrant, explore strategies like increasing marketing efforts or improving product quality to boost market share.
- Don’t ignore the potential of Dogs. Some low-performing products might be revamped or repositioned to serve niche markets.
I hope, you gain a clearer understanding of your portfolio’s strengths and weaknesses.
So, what are you waiting for?
Start building your BCG Matrix today and take your business strategy to the next level!
1 Comment