The BCG Matrix, also known as the Growth-Share Matrix, is a strategic tool used by corporations to analyze their business units or product lines.
It was created by employees of the Boston Consulting Group in the 1970s.
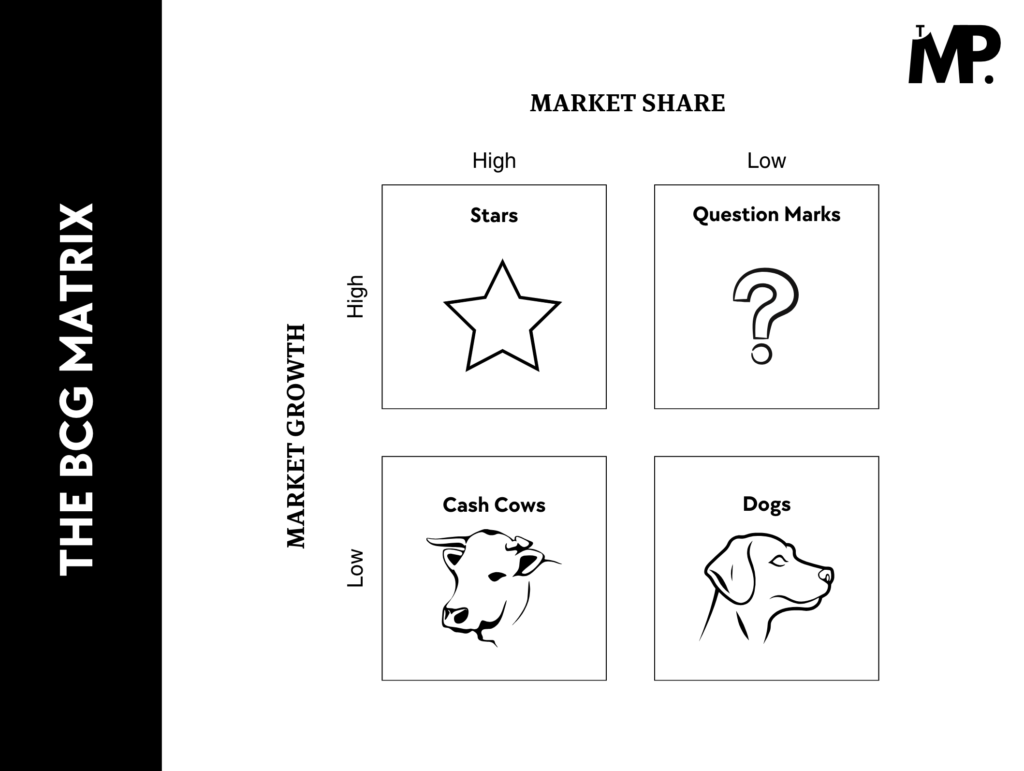
This framework helps organizations evaluate the profitability and future potential of their various offerings based on market growth and market share.
The matrix divides a company’s products or business units into four categories;
- Stars: High growth, high market share—leaders in growing markets.
- Cash Cows: Low growth, high market share—steady revenue generators in mature markets.
- Question Marks: High growth, low market share—uncertain investments needing strategic decisions.
- Dogs: Low growth, low market share—usually candidates for divestiture.
Now that you have a quick overview, let’s dive into 15 real-world BCG Matrix examples for students, focusing on popular brands and companies.
BCG Matrix Examples for Students
1. BCG Matrix of Apple
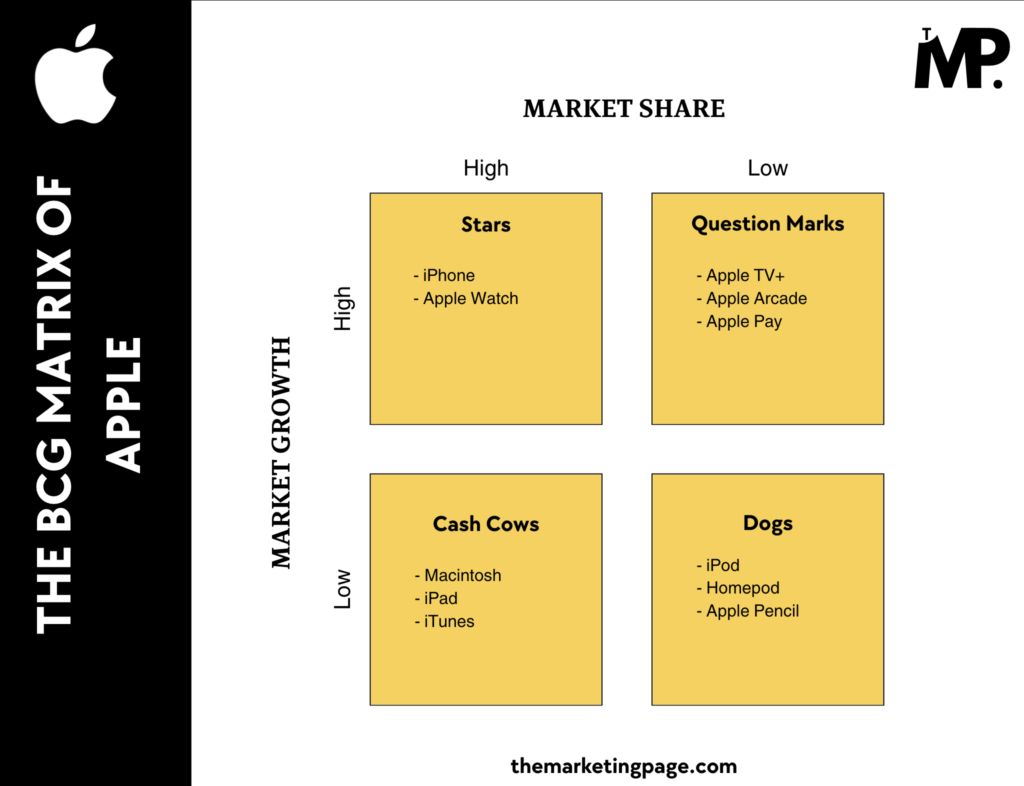
Apple’s product portfolio is a classic example of how the BCG Matrix works.
The iPhone sits comfortably in the Stars quadrant, thanks to its high market share in a fast-growing smartphone industry.
Meanwhile, the MacBook is a Cash Cow, generating steady revenue in a mature laptop market.
Read the complete BCG Matrix of Apple.
2. BCG Matrix of Nike
Nike’s Stars include its footwear segment, which dominates the athletic shoe market.
Its Equipment and accessories division operates as a Cash Cow in a slower-growth segment, while some of its less-popular sports accessories could be classified as Dogs.
Read the complete BCG Matrix of Nike.

3. BCG Matrix of Disney
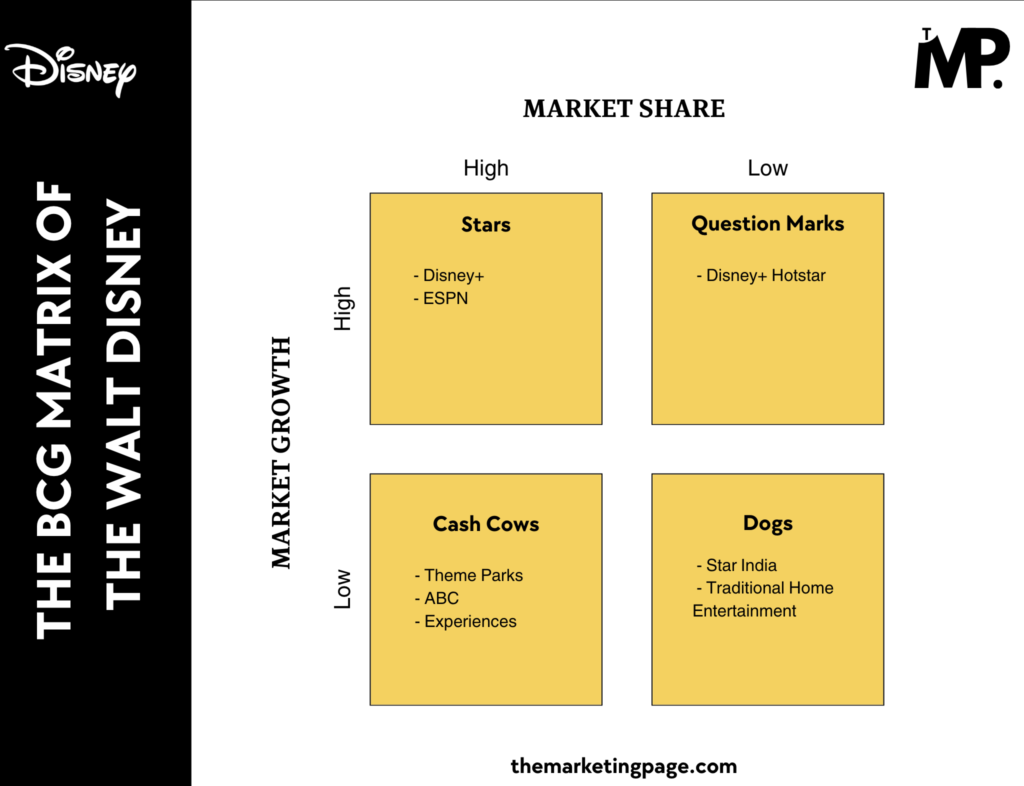
Disney’s theme parks represent its Cash Cows, providing consistent revenue over the years.
However, its streaming service, Disney+, currently belongs to the Stars quadrant as it continues to gain market share in a fast-growing industry.
Read the complete BCG Matrix of Disney.
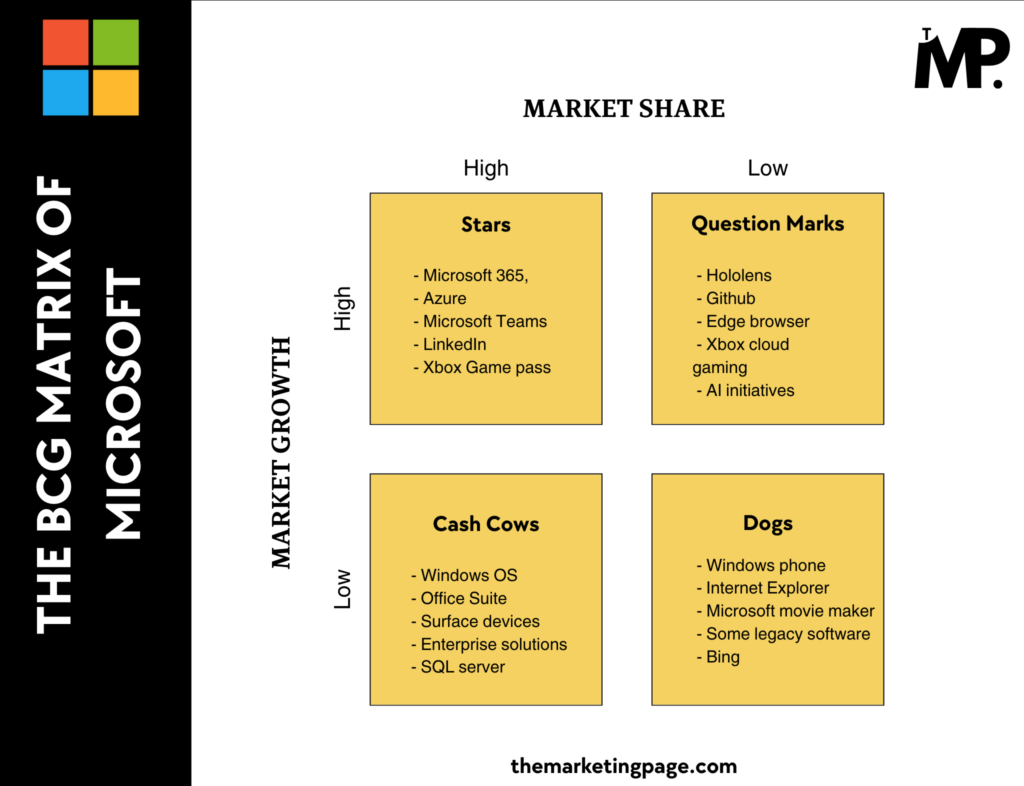
4. BCG Matrix of Microsoft
Microsoft’s Stars include its cloud computing platform, Azure, which has experienced rapid growth.
On the other hand, Windows OS, with its dominance in a stable PC market, serves as a Cash Cow.
Read the complete BCG Matrix of Microsoft.
5. BCG Matrix of Google
Google Search is a textbook Star, consistently growing.
Meanwhile, Google Shopping falls into the Question Marks quadrant.
Read the complete BCG Matrix of Google.

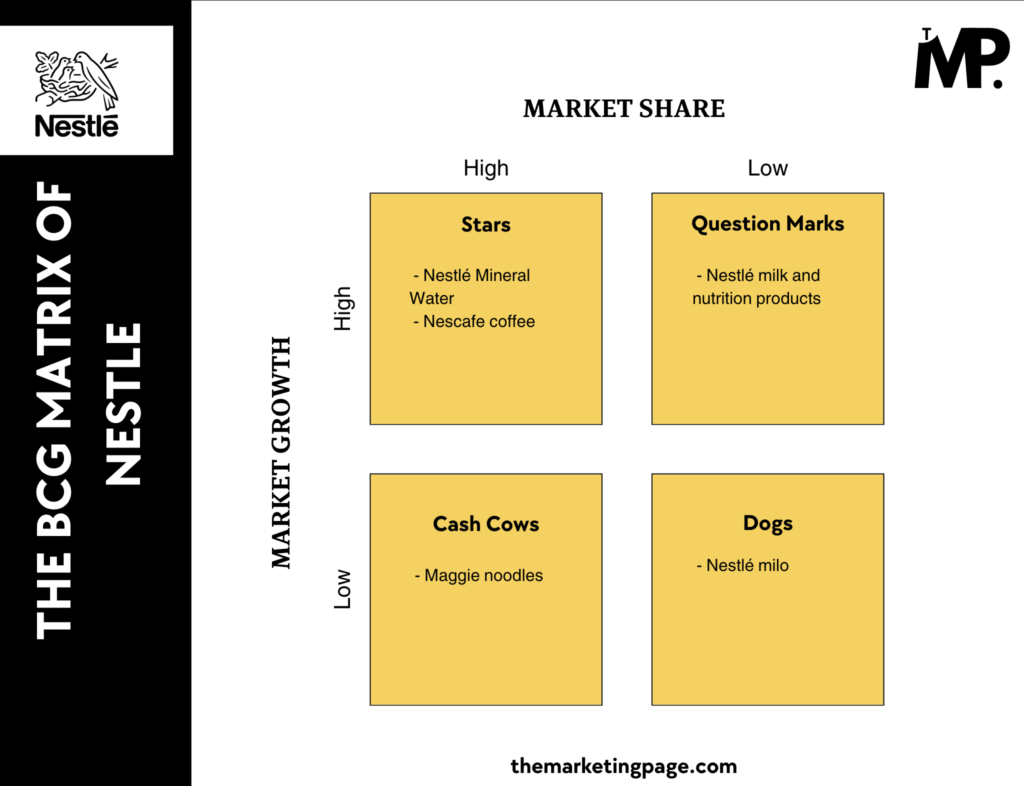
6. BCG Matrix of Nestle
Nestle’s flagship products, like Nescafe coffee, are Stars, while its newer, innovative products, such as plant-based alternatives, are Question Marks with growth potential.
Read the complete BCG Matrix of Nestle.
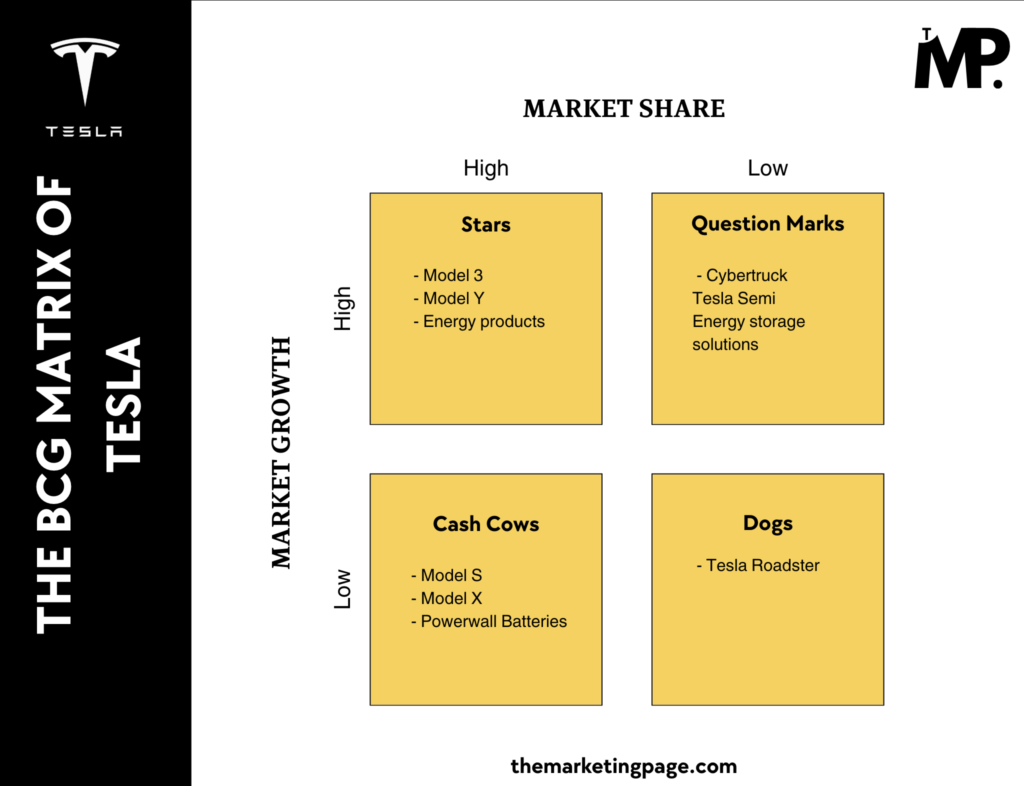
7. BCG Matrix of Tesla
Tesla’s electric vehicles, particularly the Model 3, are in the Stars quadrant due to high growth and market share.
Its solar products, however, are Question Marks, needing further investment to capture market dominance.
Read the complete BCG Matrix of Tesla.
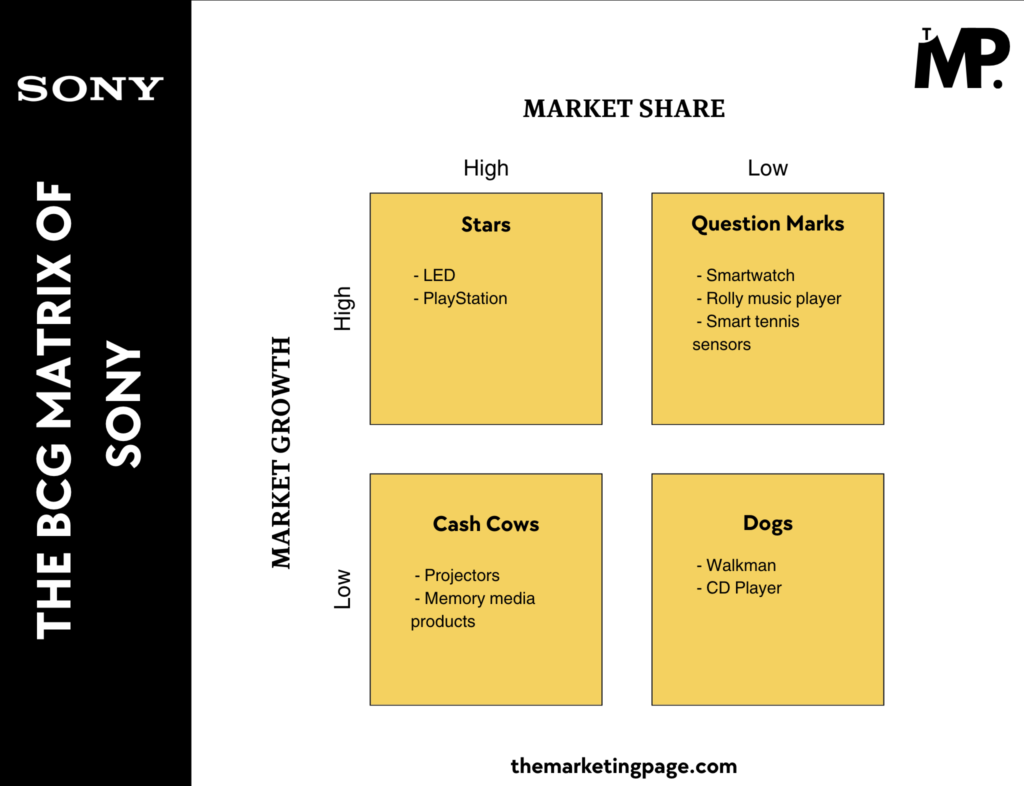
8. BCG Matrix of Sony
Sony’s gaming division, led by PlayStation, belongs to the Stars quadrant.
Meanwhile, its projectors segment has transitioned into the Cash Cows category, maintaining consistent sales in a slow-growth market.
Read the complete BCG Matrix of Sony.
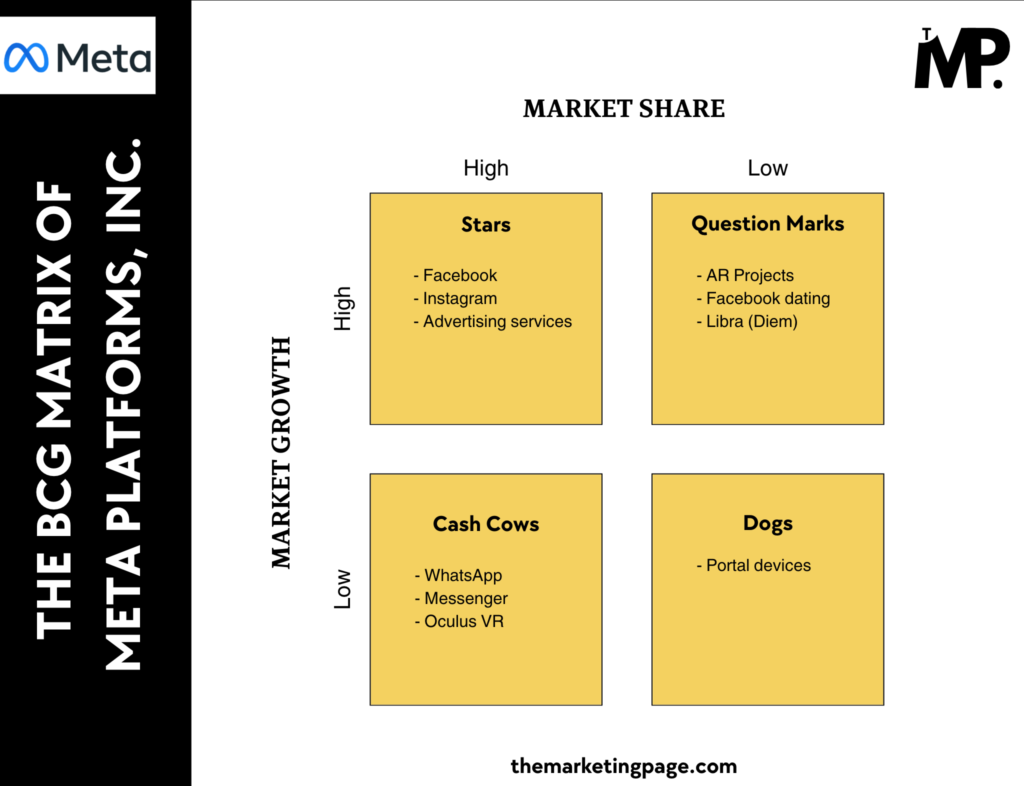
9. BCG Matrix of Meta Platforms
Meta’s core platforms, Facebook and Instagram, are Stars.
Virtual reality products like the Oculus headset are Cash Cows, with significant growth potential but limited current market share.
Read the complete BCG Matrix of Meta Platforms.
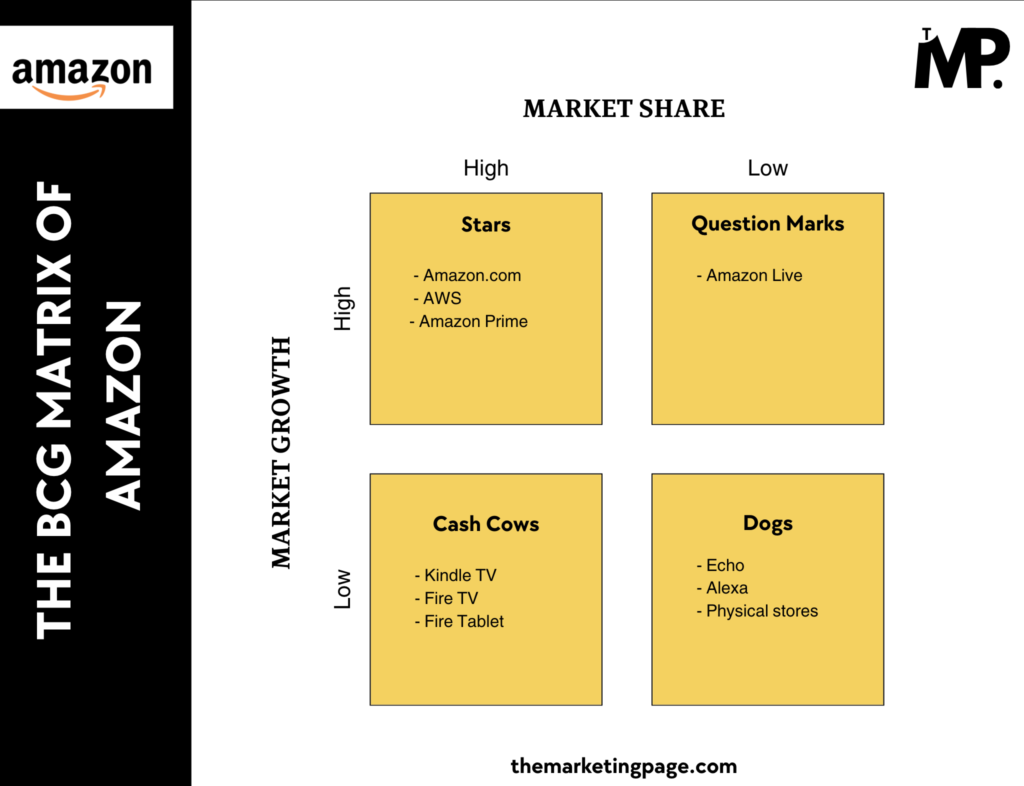
10. BCG Matrix of Amazon
Amazon’s e-commerce platform is its Star, while Kindle TV is undoubtedly a Cash Cow, dominating the cloud computing market.
Read the complete BCG Matrix of Amazon.
11. BCG Matrix of Adidas
Adidas shares a similar BCG Matrix structure to Nike. Its footwear business dominates as a Star, while some smaller product lines, such as accessories, may fall into Dogs.
Read the complete BCG Matrix of Adidas.

12. BCG Matrix of NVIDIA
NVIDIA’s GPUs are the company’s Stars, leading the gaming and AI hardware industry.
Meanwhile, its legacy products are transitioning into Cash Cows.
Read the complete BCG Matrix of NVIDIA.

13. BCG Matrix of Ford
Ford’s best-selling trucks, like the F-Series, represent Cash Cows, while its electric vehicle line is a Question Mark, needing significant growth to dominate the EV market.
Read the complete BCG Matrix of Ford.

14. BCG Matrix of Saudi Aramco
Saudi Aramco’s oil products are classic Cash Cows, providing stable income in a mature market.
Its investments in renewable energy projects are Question Marks, with potential for future growth.
Read the complete BCG Matrix of Saudi Aramco.

15. BCG Matrix of TSMC (Taiwan Semiconductor Manufacturing Company)
TSMC’s semiconductors dominate the market, making them Stars.
However, as the semiconductor industry stabilizes, some of its products may transition into Cash Cows.
Read the complete BCG Matrix of TSMC.

Conclusion
By studying these 15 examples, students can see how real-world businesses position their products across the four quadrants to maximize growth and profitability.
It’s a simple yet effective way to learn how market share and growth influence corporate strategies.
If you want to create a BCG Matrix for your project or business case study, the process is straightforward.
- Start by identifying the products or business units you want to analyze.
- Then, assess their market growth rate and market share.
- Then, categorize them into the four quadrants: Stars, Cash Cows, Question Marks, and Dogs.
To help you get started, I’ve written a detailed guide on How to Create a BCG Matrix.
It walks you through each step (including formulas you can apply), making it easy to apply this framework in your studies or real-world scenarios.
I’ve taken Samsung Q1 2024 as an example to explain it.
Check it out and put your strategic thinking into action!
Leave a Comment